TN Rainfall data collection and analysis
🌧️ ETL Process for Rainfall Data in Tamil Nadu 🌧️
Overview
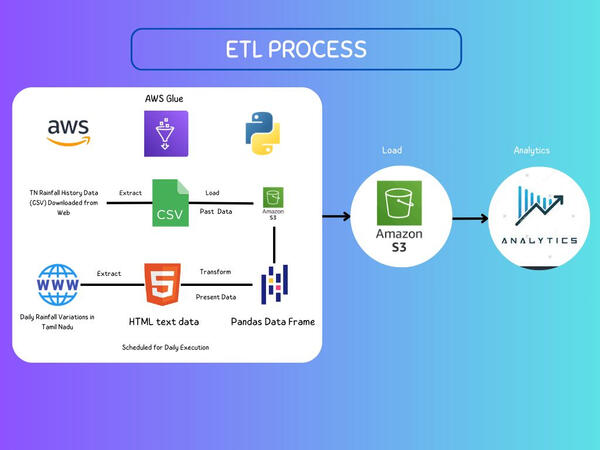
🚀 Transforming raw data into actionable insights is essential for informed decision-making, especially in weather and climate analytics. Here's how we built an end-to-end ETL pipeline for rainfall data in Tamil Nadu:Data Collection and Transformation
1. Extract
🔍 Historical Data:
Sourced from government portals & meteorological archives.
📅 Daily Data:
Python scripts automate data extraction via APIs & web scraping.
Scheduled jobs in AWS Glue run daily.2. Transform
🧹 Data Cleaning:
Handled missing/inconsistent values.
Standardized date-time formats and measurement units.
📊 Data Processing:
Aggregated by district, zone, and state.
Calculated metrics like daily averages, monthly totals, and deviations.3. Load
💾 Storage:
Transformed data stored in AWS S3 for long-term access.
Partitioned by year, month, and district for efficient querying.
📈 Daily Updates:
Incremental updates ensure historical integrity while integrating new data.
Automation with AWS Glue
Daily triggers execute Python-based ETL pipelines.
Organized data in structured formats like CSV and Parquet for easy analysis.
Click the image to view code files
🚀 Automating Data Collection for Historical Rainfall Data
💡 Efficiency Unlocked with Python and SeleniumI embarked on a project to automate web scraping for historical rainfall data.challenge
The website I used has a search bar without direct, shareable URLs for date-based queries. Manually inputting dates, saving files, and extracting data was time-consuming—taking hours for just a year of data.Solution
I developed a solution using Selenium and BeautifulSoup to automate date-based queries and extract tabular rainfall data dynamically. Here’s a breakdown of the process:
Automated Form Input: Looping through a range of dates to simulate manual input.
Dynamic Data Extraction: Parsing the response with BeautifulSoup to handle HTML tables.
Data Transformation: Cleaning and structuring results into a pandas DataFrame for analysis.
Error Handling: Accounted for no-rainfall days by inserting placeholder records.Performance
⏱ Before automation: 50 minutes per year of data.
⚡ After: Hands-off data retrieval, fully automated!Core Tools Used
Selenium for browser automation
BeautifulSoup for HTML parsing
pandas for data processingTakeaway
This project not only saved time but also enhanced data accuracy and repeatability. It’s a reminder of how leveraging automation can transform tedious manual processes into streamlined solutions.
🚀 Analyzing Rainfall Variations: Insights and Trends💡 Efficiency Unlocked with Python, Selenium, and Real-Time Visualization
After successfully automating the web scraping of historical rainfall data using Python, Selenium, and BeautifulSoup, I took it a step further by integrating the data into a dynamic dashboard using Looker Studio.Project Expansion:
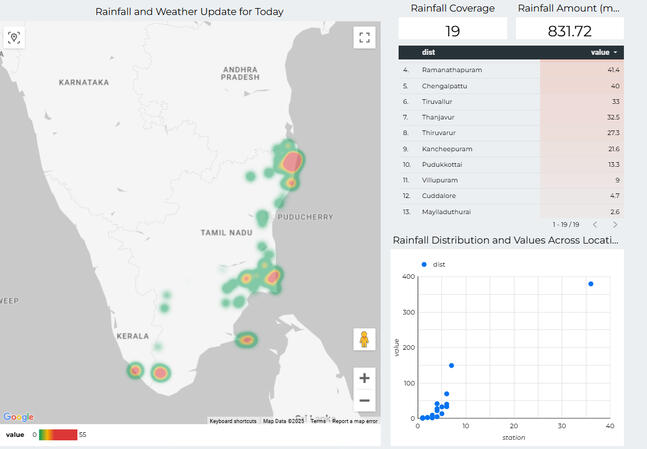
With the raw data now automatically collected and cleaned, the next challenge was creating real-time visualizations to make the insights more accessible and actionable. Here's what I’ve built:Dashboard Highlights:
📍 Daily Rainfall Occurrence: Visualized across Tamil Nadu, showing rainfall details for each district.
📊 Station vs. Value-wise Rainfall Occurrence: A scatter plot to compare rainfall data across different stations and values.
**📅 Weekly Rainfall Analysis: **Trends and patterns of rainfall every week.
📆 Monthly Rainfall Analysis: View district-specific rainfall values, month-wise.
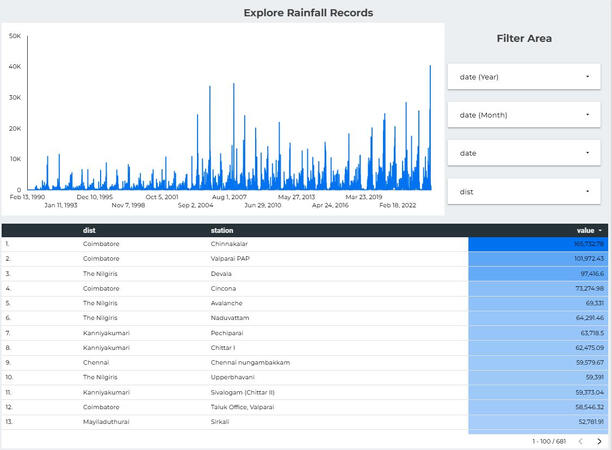
🌧 All Years of Rainfall Occurrence: A dynamic view of the entire dataset, updated daily.
🌙 Monsoon Activity Monitoring: Monthly patterns showing the influence of the monsoon season across years.
Highlights:
📍 Filter district-specific rainfall data.
📊 Compare station-wise rainfall trends.
🌙 Analyze monsoon patterns across years.
📅 Dynamic daily, weekly, and monthly updates.Why Looker Studio?x
Looker Studio enables dynamic updates to the dashboard, offering real-time insights into rainfall data, which is crucial for ongoing analysis and decision-making. This also empowers stakeholders with interactive charts and filters for a deeper understanding of regional weather trends.
Key Benefits:
Dynamic, Real-Time Insights
Easy-to-Use Interactive Dashboard
Streamlined Data Collection + Visualization🚀 This end-to-end automated process not only saves a tremendous amount of time but also provides stakeholders with an intuitive and up-to-date view of rainfall patterns.
Click the image to view the live Dashboard.